 Managing IT infrastructure, including network devices, servers, operating systems, and databases, has grown increasingly complex as organizations scale and adopt multi-vendor environments. Our proprietary software solution offers enhanced customizability and operational flexibility, enabling more seamless and centralized IT asset management.
Key Challenges:
Complexity in centralized oversight: Multi-vendor hardware leads to fragmented visibility and disjointed monitoring, complicating centralized control.
Limited flexibility of pre-packaged solutions: Off-the-shelf software lacks the scalability and customization required to address enterprise-specific configurations and workflows.
Scalability issues: As infrastructure expands, vendor-packaged solutions often lack the modularity and adaptability to support dynamic growth and evolving requirements.
Suboptimal monitoring and alerting: Existing tools frequently lack real-time monitoring and predictive alerting, reducing responsiveness to potential issues.
High operational costs: Proprietary software often incurs high licensing and maintenance fees, with increasing costs as infrastructure scales.
Executive Summary
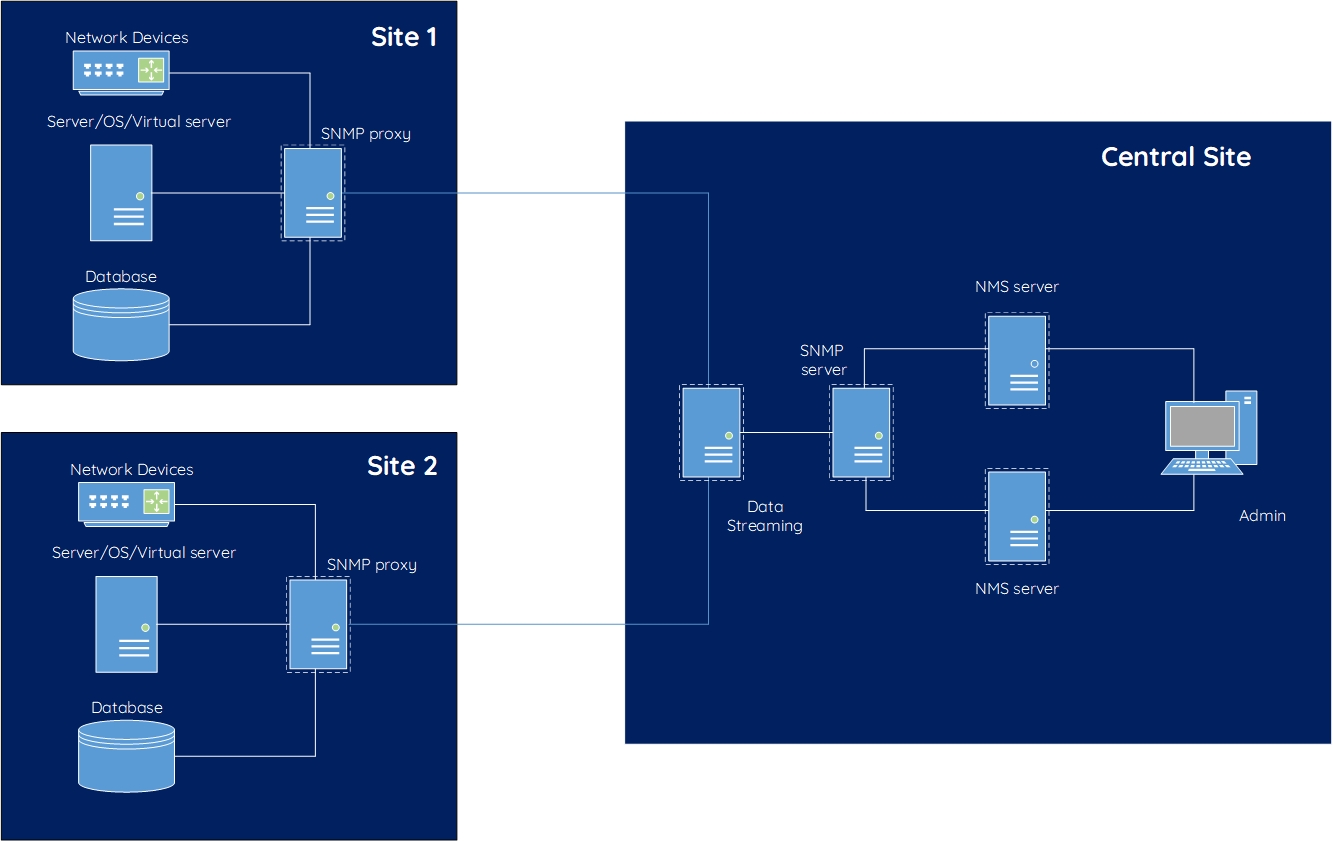
Our IT device management solution is engineered to streamline the monitoring and control of complex infrastructures, leveraging SNMP for data collection from network devices, servers, operating systems, and databases. For distributed environments, we deploy SNMP proxies across various customer sites, enabling efficient and synchronized data aggregation from multiple locations.
Once collected, the data is ingested into the Kafka data streaming architecture, ensuring real-time processing and robust data flow management across multiple sources. Kafka serves as a crucial backbone for data distribution and high-performance streaming, maintaining a stable and continuous flow of information.
At the heart of our solution is the Zabbix monitoring system, which we have specially optimized for handling and processing SNMP data. This enhanced Zabbix platform not only standardizes the collected data but also computes essential metrics, ensuring that the output is precise and highly actionable before being presented to the end users.
Finally, after the data is normalized and processed, it is displayed through advanced dashboards and dynamic visualizations, providing users with clear, real-time insights into device status, enabling prompt issue detection and data-driven management decisions.
Advantages
Architectural Model:

Network Device and Server Monitoring:
- Device resources: CPU, RAM, temperature, throughput capacity
- Device interface: transmission and reception rate (bandwidth)
- Network connection monitoring
Alert and Operational Management:
- Definition of alert policies
- Incident management ticketing system
- Network impact management
- Maintenance operations management
- Incident resolution knowledge base
Database Management:
- Database server performance.
- Database performance: response time, number of sessions, CPU resources, RAM, disk usage, etc.
- Performance of a specific SQL statement.
Network Quality Management:
- Calculate and display KPIs related to network and service quality.
- Establish a digital map for transmission and data communication.
- Chatbot that answers questions related to network quality.


